Momentum Metrics: How Performance Data Streams Alter Proposition Lines in Striking and Fielding Events
Written by Carlo Neumann · Aug 26, 2026

Momentum Metrics: How Performance Data Streams Alter Proposition Lines in Striking and Fielding Events
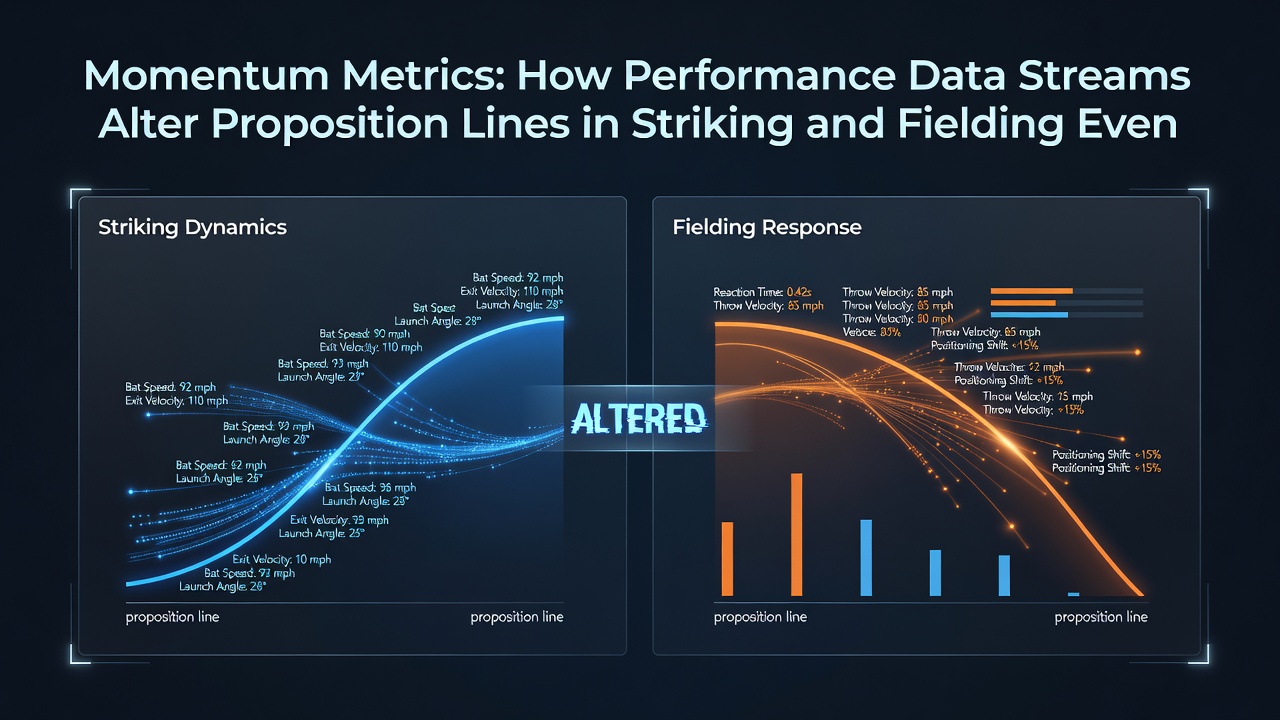
Performance data streams now feed directly into proposition markets for striking and fielding sports, where live metrics on bat speed, footwork, and fielding reaction times shift odds on individual player outcomes. Cricket and baseball serve as primary examples because both feature clear striking actions and defensive fielding sequences that generate measurable data points every delivery or pitch.
Data Integration in Cricket Markets
Ball-tracking systems capture release speed, seam angle, and bounce height within milliseconds, and these figures update batsman run lines and bowler wicket props in real time. When a fast bowler maintains an average speed above 145 kilometres per hour across consecutive overs, operators adjust the over-4.5 runs concession line downward because historical datasets link sustained pace to lower scoring rates. Fielders positioned deeper on the leg side after early short balls often trigger immediate shifts in the next-man-out market because placement data shows higher catch probability in those zones.
Strike-rate thresholds also move when batters face specific lengths. A batsman who has faced ten deliveries on a length outside off stump without scoring may see his runs-over-25 line lengthen because the data indicates a temporary dip in scoring efficiency. August 2026 saw several limited-overs series where such adjustments occurred within two overs of the relevant sequence, demonstrating how quickly lines respond once the data pipeline updates.
Baseball Proposition Adjustments
Similar patterns appear in baseball where exit velocity and launch angle streams alter over-1.5 total-bases lines for hitters and strikeout props for pitchers. When a starting pitcher records first-pitch strikes on 70 percent of batters through three innings, the strikeout-over-6.5 line typically tightens because pitch-location data correlates strongly with swing-and-miss rates later in the outing. Outfielders who record above-average jump metrics on fly balls see their individual putout lines shorten in subsequent innings because defensive positioning algorithms update the expected catch probability.
Teams that maintain high sprint speeds between bases also influence stolen-base props because acceleration data feeds directly into the model. One dataset compiled across major-league seasons showed that runners who average 27 feet per second on the first step trigger line movement within the same half-inning when their next at-bat approaches.
Cross-Sport Comparison Patterns
Both sports reveal consistent operator responses once momentum metrics breach established thresholds. Cricket wicket props tighten after a bowler delivers three consecutive deliveries that beat the bat, while baseball strikeout props shorten after a pitcher throws eight pitches above 95 miles per hour in a single frame. The common mechanism involves real-time feeds that compare current sequences against multi-season baselines, then recalculate probability distributions for the remaining deliveries or pitches.
Operators source these feeds from multiple providers, and the Nevada Gaming Control Board has documented how such data integration affects market stability across jurisdictions. A separate analysis from the Australian Gambling Research Centre examined timing differences between data receipt and line movement, revealing average adjustment windows of 12 to 18 seconds once the metric crosses the threshold.
Market Response Mechanisms
Bookmakers maintain internal models that weight recent performance clusters more heavily than season-long averages when the sample size remains small. This weighting produces sharper line movement during the middle overs of a cricket innings or the middle innings of a baseball game. When a fielder records two diving stops in the same over, the next-ball boundary line often widens because the data indicates increased likelihood of the batsman attempting riskier shots to regain momentum.
Conversely, a striker who has defended eight consecutive deliveries without scoring sees the under-0.5 runs line shorten because the defensive fielding metrics show the bowler maintaining tight lines that limit scoring options. These adjustments occur automatically once the data stream confirms the sequence, and they remain in place until new deliveries reset the relevant cluster.
Conclusion
Real-time performance data streams have become the primary driver behind proposition line changes in striking and fielding events. Cricket and baseball markets demonstrate parallel responses where velocity, placement, and reaction metrics trigger immediate recalibrations. As data collection technology continues to advance, operators rely on these streams to maintain accurate pricing across individual player props and sequence-based outcomes.