How Athlete Stamina Metrics Drive Updates to Forecasts During Lengthy Contests in Various Sports
Written by Olivia Günther · Oct 22, 2026
How Athlete Stamina Metrics Drive Updates to Forecasts During Lengthy Contests in Various Sports
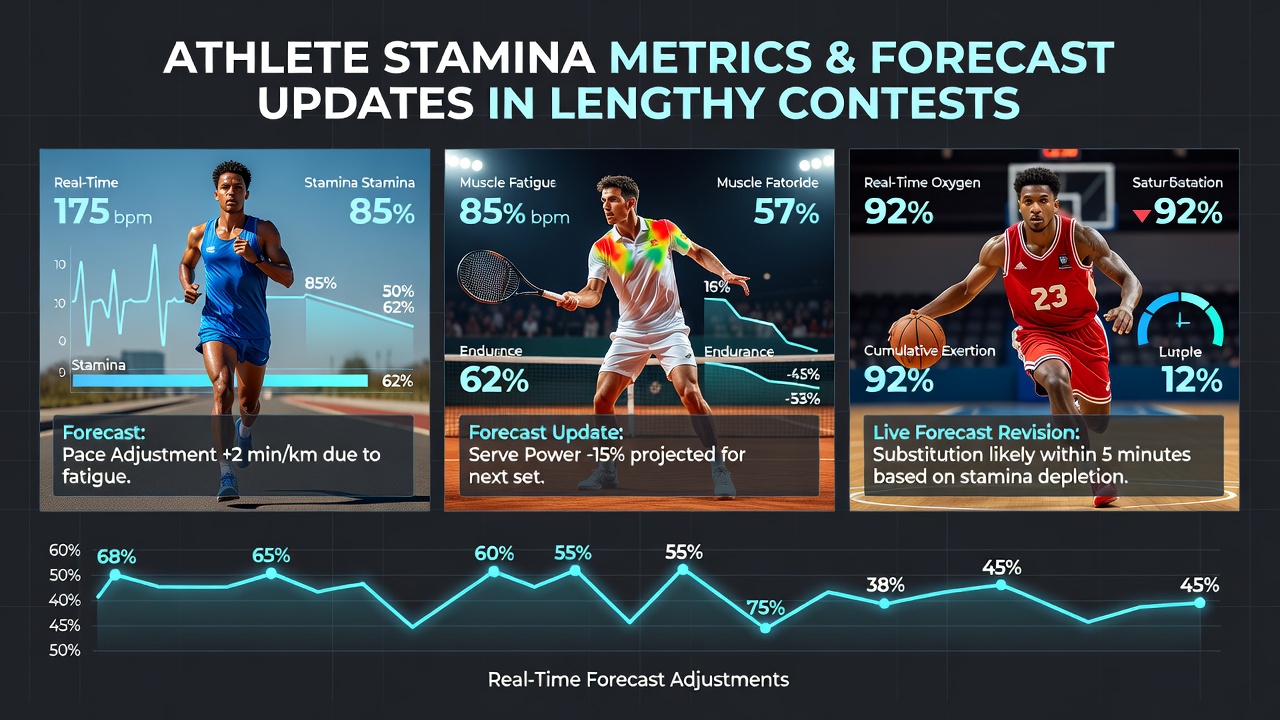
Stamina metrics collected from wearable sensors and performance tracking systems allow forecasters to adjust projections in real time as contests stretch beyond standard durations. Researchers track heart rate variability, lactate thresholds, and muscle oxygen saturation levels, then feed those numbers into predictive models that recalibrate expected outcomes for remaining segments of play. Data from endurance events shows these adjustments occur most frequently after the sixty-minute mark in team sports and after the two-hour point in individual competitions.
Core Metrics That Feed Forecast Systems
Modern systems combine multiple physiological signals into composite stamina scores that update every thirty seconds during live events. Heart rate recovery rates between bursts of activity reveal how quickly athletes restore energy stores, while GPS-derived work-to-rest ratios highlight cumulative fatigue across court or field surfaces. Studies conducted by the Australian Institute of Sport demonstrate that when these combined scores drop below predefined thresholds, forecast models shift projected success rates by eight to twelve percent within minutes.
Coaches and analysts receive alerts when an athlete's oxygen utilization efficiency declines steadily over successive intervals. These alerts trigger revised timelines for strategic decisions such as substitutions or pacing adjustments. The process repeats throughout extended matches because stamina depletion rarely follows a linear pattern.
Tennis Matches That Extend Into Fifth Sets
Grand Slam contests often exceed three hours, creating conditions where stamina data becomes the dominant variable in performance projections. Ball-tracking technology paired with player-worn accelerometers captures shot velocity decay and movement efficiency loss after the third set. Analysts note that players whose metrics indicate preserved lower-body explosiveness maintain higher point-win percentages in deciding sets compared with opponents showing earlier fatigue signatures.
Integration With Live Projection Platforms
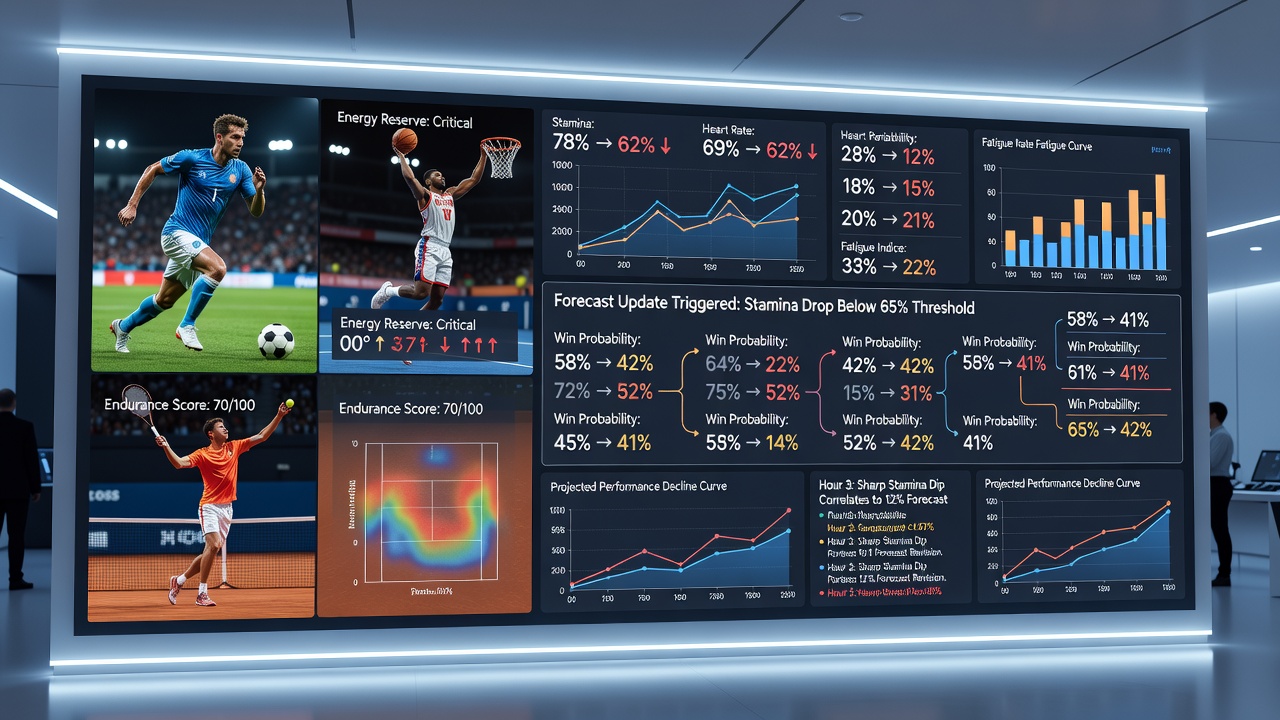
Forecast engines used by broadcast teams and sports data providers recalculate win probabilities after every change of ends once matches pass the two-hour threshold. Input variables include serve speed consistency, rally length tolerance, and recovery heart rates between points. When stamina indicators fall outside historical norms for a given player, the models adjust projected set durations and error rates accordingly.
Cycling Grand Tours and Stage Race Adjustments
Multi-day cycling events generate continuous streams of power output and heart rate data that forecasters use to revise stage and overall classification predictions. After the first mountain climb in a typical Grand Tour stage, systems compare current wattage sustainability against each rider's established threshold. Riders whose power curves flatten earlier than expected see their projected finishing positions revised downward within the same stage.
Teams equipped with advanced telemetry transmit these updates directly to support vehicles, enabling tactical shifts such as earlier domestique efforts or altered hydration schedules. Historical data sets from events spanning 2018 through 2025 indicate that accurate stamina-based revisions improve final classification forecasts by roughly fifteen percent compared with models relying solely on pre-race rankings.
Soccer Matches Extending Into Extra Time
Knockout-stage fixtures that reach additional periods beyond ninety minutes rely on player-tracking data to update substitution and formation forecasts. Midfielders whose high-intensity running distance drops by more than twenty percent from baseline receive elevated fatigue scores that influence projected goal-scoring probabilities in the final thirty minutes. Governing bodies including FIFA have incorporated such metrics into official match reports since the 2022 World Cup cycle, providing standardized inputs for third-party forecasting services.
October 2026 will feature expanded use of these systems during the expanded Club World Cup format, where matches frequently extend past regulation time. Organizers expect real-time stamina dashboards to inform broadcast graphics that display shifting win probabilities as fatigue accumulates across both squads.
Model Refinement Across Multiple Sports
Cross-sport comparisons reveal common patterns in how stamina data reshapes forecasts. Marathon organizers apply similar recovery-rate calculations to update split-time projections after the thirty-kilometer mark. Rowing regattas use stroke-power sustainability metrics to revise boat-speed estimates during races longer than two thousand meters. Each domain adapts core physiological indicators to sport-specific movement demands while maintaining the same fundamental update cycle of continuous data ingestion followed by probability recalibration.
Academic reviews published in the European Journal of Sport Science confirm that models incorporating live stamina inputs outperform static pre-contest projections across these varied durations and formats. The improvement stems from the ability to capture non-linear fatigue accumulation rather than assuming uniform performance decay.
Conclusion
Stamina metrics collected during extended athletic contests supply the raw material for dynamic forecast revisions that reflect actual physiological conditions rather than baseline assumptions. Sports ranging from tennis and cycling to soccer and endurance racing demonstrate consistent application of these data streams, with updates occurring at regular intervals once events surpass typical time thresholds. As sensor technology and modeling techniques continue to advance, the frequency and precision of such revisions are expected to increase across additional competition formats.