Analytics Alignment: Matching Key Metrics Across Soccer, Tennis, and Basketball for Strategic Multi-Outcome Bets
Written by Otto Hoffmann · Aug 14, 2026
Analytics Alignment: Matching Key Metrics Across Soccer, Tennis, and Basketball for Strategic Multi-Outcome Bets
Data from multiple sports leagues indicates that certain performance indicators share structural similarities even though the games themselves differ in pace and scoring patterns, and analysts in August 2026 continue to refine models that map these indicators onto combined betting outcomes across soccer, tennis, and basketball.
Defining Comparable Efficiency Measures
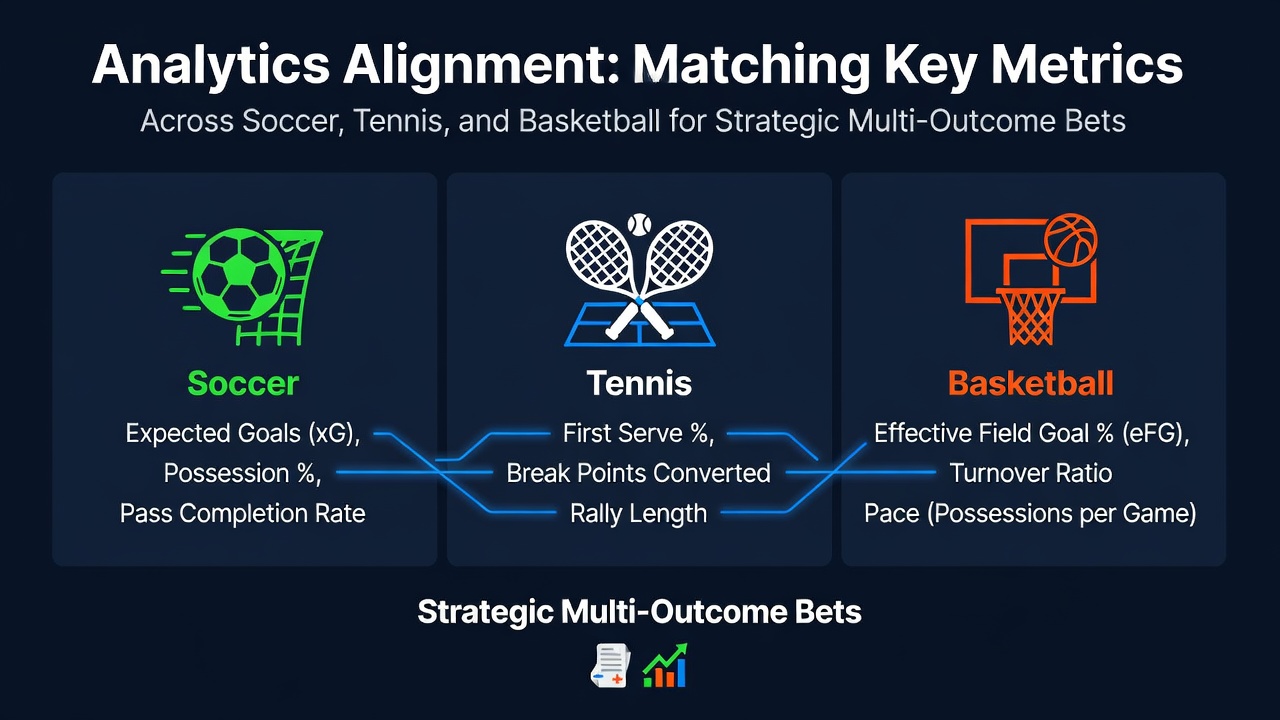
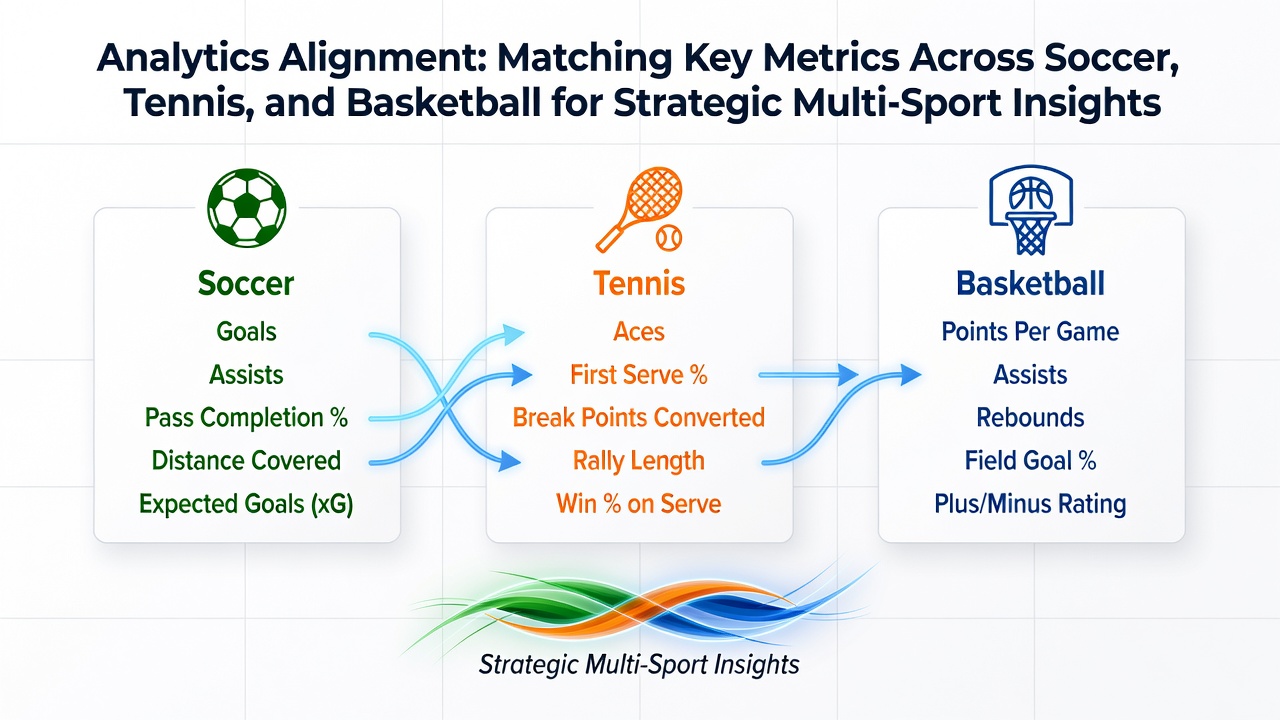
Soccer tracks expected goals per shot alongside possession value, while tennis records first-serve win percentages and break-point conversion rates, and basketball monitors effective field-goal percentage together with assist-to-turnover ratios; researchers have identified that each of these figures functions as a conversion efficiency metric that can be normalized against league averages to create cross-sport benchmarks.
One study published by the University of Queensland's Centre for Sport Analytics demonstrated that converting raw efficiency numbers into z-scores allows direct comparison between a soccer team's shot quality rating and a basketball team's scoring efficiency, and the same scaling process applies to tennis service dominance when match length and surface speed enter the equation.
Momentum and Sequence Indicators
Sequence-based statistics reveal further alignment opportunities, because soccer counts progressive carries and passes into the final third, tennis logs rally lengths before points end, and basketball records scoring runs within quarters; these sequences all capture short-term surges that betting models treat as momentum proxies when constructing multi-leg wagers.
Figures released by the NBA's player-tracking database show that teams posting above-average run frequencies in the first half also tend to sustain elevated effective field-goal numbers later, and parallel patterns appear in soccer when clubs generate clusters of high-value attacks within fifteen-minute windows, while tennis data from the ATP tour indicates that extended rallies often precede service-break clusters.
Applying Normalized Metrics to Multi-Outcome Structures
Betting platforms that accept combined outcomes across different sports require these normalized values to weight individual legs, and August 2026 schedules feature overlapping windows where major soccer leagues, tennis hard-court swings, and basketball preseason tournaments coincide, giving modelers fresh datasets for calibration.
Operators adjust accumulator odds by comparing a soccer side's expected-goals surplus against a tennis player's recent break-point conversion differential and a basketball club's quarter-specific pace advantage, then they multiply the resulting probabilities while inserting correlation buffers derived from historical overlap periods.
Data Sources and League Reporting Standards
League-wide reporting standards have improved since 2024, with the NBA supplying granular play-by-play files, the Association of Tennis Professionals releasing point-level JSON exports, and European soccer federations providing event data through centralized repositories; these streams feed into third-party alignment engines that recalibrate coefficients every two weeks during peak seasons.
According to documentation from the Australian Sports Commission research portal, standardized z-score transformations reduce variance when metrics travel between sports, and the same portal notes that surface-specific tennis adjustments must be reapplied before merging with indoor basketball data.
Practical Construction of Cross-Sport Accumulators
Traders begin by selecting one efficiency metric and one momentum metric from each sport, then they verify that the chosen indicators display low historical covariance during simultaneous competition periods; this verification step prevents overcounting of shared variance when the final multiplier reaches the odds engine.
Market data collected across the 2025-2026 overlap window shows that pairings such as soccer progressive-pass surplus with basketball transition frequency and tennis return-point win rate produce stable joint probabilities once surface and venue adjustments are included, whereas pairings that ignore venue effects require wider margin buffers.
Conclusion
Alignment frameworks rest on the repeated observation that efficiency and sequence indicators can be rescaled and compared once league baselines are removed, and the process continues to evolve as August 2026 data streams arrive from concurrent soccer, tennis, and basketball competitions.